Open data · HMBD version 2025-05-26
Twin Birth Data Atlas: rates by country and year
Explore 2,617 annual observations across 25 countries. The comparable metric used here is twin deliveries per 1,000 total deliveries, not the number of twin babies per 1,000 births.
25
countries and territories
2,617
selected country-year observations
1815
earliest retained observation
2023
latest HMBD year in this release
Comparable HMBD series
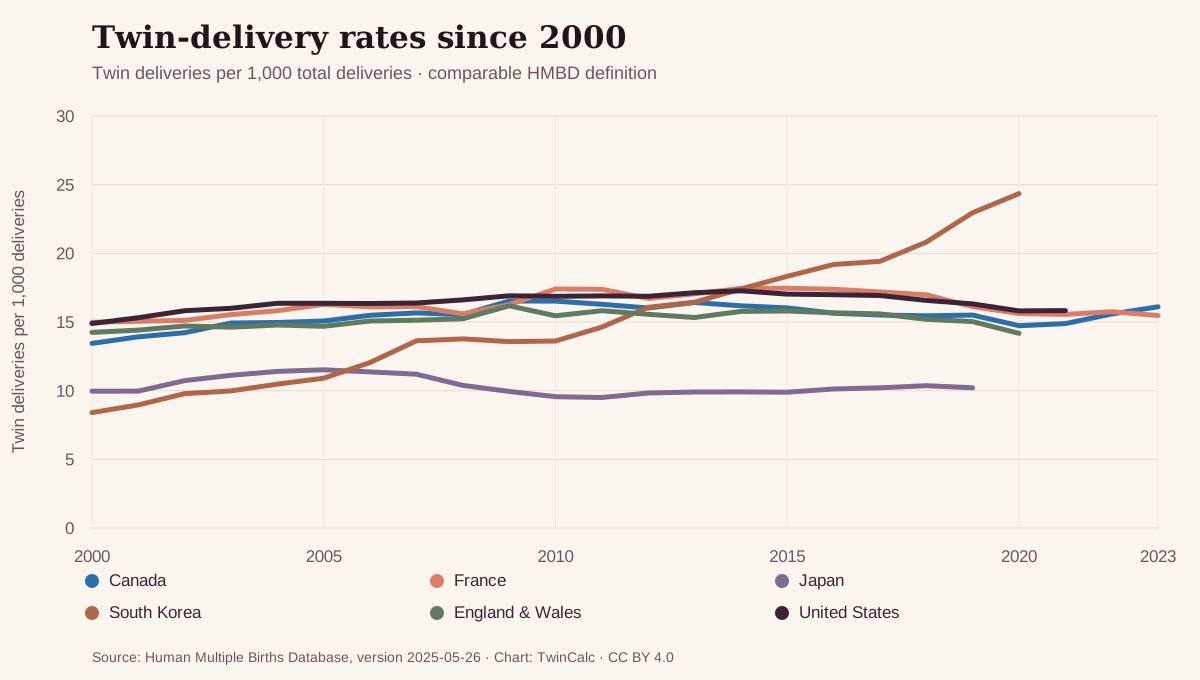
Twin-delivery rates since 2000
The chart keeps the HMBD definition throughout. Diverging country paths should not be interpreted as causal evidence about fertility treatment, maternal age or genetics without country-specific analysis.
Country table
Latest available HMBD observation
“Latest” is country-specific and ranges from 1996 to 2023 in this release. The table is alphabetical rather than a ranking because reference years and stillbirth coverage differ.
| Country | Latest year | Twin deliveries / 1,000 | Near-2000 rate | Change | Stillbirths | Source |
|---|---|---|---|---|---|---|
| Australia | 2020 | 14.29 | 15.47 (2000) | -7.6% | Mixed | ABS |
| Austria | 2021 | 14.49 | 12.75 (2000) | +13.6% | Included | Statistik Austria |
| Canada | 2023 | 16.11 | 13.44 (2000) | +19.9% | Included | StatCan |
| Chile | 2021 | 11.26 | 8.35 (2000) | +34.9% | Excluded | INE |
| Czech Republic | 2020 | 13.37 | 15.24 (2000) | -12.3% | Included | CZSO |
| Denmark | 2022 | 13.82 | 19.49 (2000) | -29.1% | Included | DST |
| Finland | 2019 | 12.67 | 16.04 (2000) | -21.0% | Included | Tilastokeskus |
| France | 2023 | 15.47 | 14.98 (2000) | +3.3% | Included | INSEE |
| Germany | 2020 | 17.93 | 15.24 (2000) | +17.7% | Included | Destatis |
| Greece | 2022 | 28.68 | 19.98 (2000) | +43.5% | Included | ELSTAT |
| Iceland | 2020 | 11.86 | 17.16 (2000) | -30.9% | Included | Statistics Iceland |
| Italy | 1996 | 11.16 | n/a | n/a | Included | ISTAT |
| Japan | 2019 | 10.21 | 9.96 (2000) | +2.5% | Included | StatisticsJapan |
| Lithuania | 2020 | 17.31 | 9.91 (2000) | +74.7% | Included | Statistics Lithuania |
| Netherlands | 2020 | 15.13 | 17.85 (2000) | -15.2% | Included | CBS |
| New Zealand | 2021 | 13.14 | 15.74 (2000) | -16.5% | Included | Stats NZ |
| Norway | 2020 | 13.28 | 17.69 (2000) | -24.9% | Included | SSB |
| Republic of Korea | 2020 | 24.35 | 8.40 (2000) | +189.9% | Excluded | KOSIS |
| Spain | 2021 | 16.38 | 15.22 (2000) | +7.6% | Included | INE |
| Sweden | 2020 | 13.64 | 16.11 (2000) | -15.3% | Included | SCB |
| Switzerland | 2020 | 15.64 | 13.90 (2000) | +12.5% | Included | OFS |
| UK-England and Wales | 2020 | 14.18 | 14.24 (2000) | -0.4% | Included | ONS |
| UK-Scotland | 2020 | 14.50 | 14.01 (2000) | +3.5% | Included | NRS |
| United States | 2021 | 15.83 | 14.89 (2000) | +6.3% | Mixed | NVSR |
| Uruguay | 2020 | 12.80 | 8.30 (2000) | +54.2% | Mixed | MSP-INE |
Newer official releases
Useful updates that use different metrics
United States · 2024
30.1
twin babies per 1,000 total births
The CDC reports an 11% decline from the 2014 peak of 33.9 to 30.1 in 2024. This is a birth-level rate, not the HMBD delivery-level rate.
CDC NCHS report →England and Wales · 2024
13.8
multiple maternities per 1,000 maternities
The ONS reports a 4.2% decrease from 14.4 in 2023. This measure includes twins and higher-order multiples and therefore is not the HMBD twinning rate.
ONS statistical bulletin →Methodology and reuse
How this atlas was built
The source is the Human Multiple Births Database distributed by INED. HMBD compiles national vital-statistics series and documents country-specific definitions. The source release is licensed under CC BY 4.0.
Some country-years contain more than one row. For the visual series, TwinCalc prefers records that include stillbirths, then records excluding stillbirths, mixed coverage and unknown coverage. Ties are resolved using the largest delivery denominator. The full derived CSV exposes the selected source code, stillbirth flag and number of candidate rows.
These data describe populations, not an individual probability. A trend does not establish why it changed. Country comparisons may reflect differences in registration, fertility treatment, maternal age, stillbirth definitions and data revisions.
Recommended attribution
Human Multiple Births Database (2025). Institut national d’études démographiques – INED (distributor). Retrieved from twinbirths.org on 10 July 2026. Derived selection and presentation by TwinCalc.